
Ext.js 折线图
 Ext.js 图表
描述
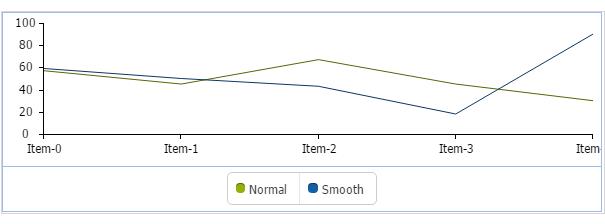
此图表用于以线图格式表示数据。 它是一个笛卡尔图表。语法
这里是简单的语法。Ext.create('Ext.chart.CartesianChart',{
series: [{
type: 'line',
xField: 'name',
yField: 'G1'
}]
render, legend and other properties
});
例
下面是一个简单的例子显示用法。<!DOCTYPE html> <html> <head> <link href="https://cdnjs.cloudflare.com/ajax/libs/extjs/6.0.0/classic/theme-classic/resources/theme-classic-all.css" rel="stylesheet" /> <script type="text/javascript" src="https://cdnjs.cloudflare.com/ajax/libs/extjs/6.0.0/ext-all.js"></script> <script type="text/javascript" src="https://cdnjs.cloudflare.com/ajax/libs/extjs/6.0.0/packages/charts/classic/charts.js"></script> <link href="https://cdnjs.cloudflare.com/ajax/libs/extjs/6.0.0/packages/charts/classic/classic/resources/charts-all.css" rel="stylesheet" /> <script type="text/javascript"> Ext.onReady(function() { Ext.create('Ext.chart.CartesianChart', { renderTo: document.body, width: 600, height: 200, store: { fields: ['name', 'g1', 'g2'], data: [ {"name": "Item-0", "g1": 57, "g2": 59}, {"name": "Item-1", "g1": 45, "g2": 50}, {"name": "Item-2", "g1": 67, "g2": 43}, {"name": "Item-3", "g1": 45, "g2": 18}, {"name": "Item-4", "g1": 30, "g2": 90} ] }, legend: { docked: 'bottom' }, //define x and y axis. axes: [{ type: 'numeric', position: 'left' }, { type: 'category', visibleRange: [0, 1], position: 'bottom' }], //define the actual series series: [{ type: 'line', xField: 'name', yField: 'g1', title: 'Normal' }, { type: 'line', xField: 'name', yField: 'g2', title: 'Smooth' }] }); }); </script> </head> <body> </body> </html>
这将产生以下结果